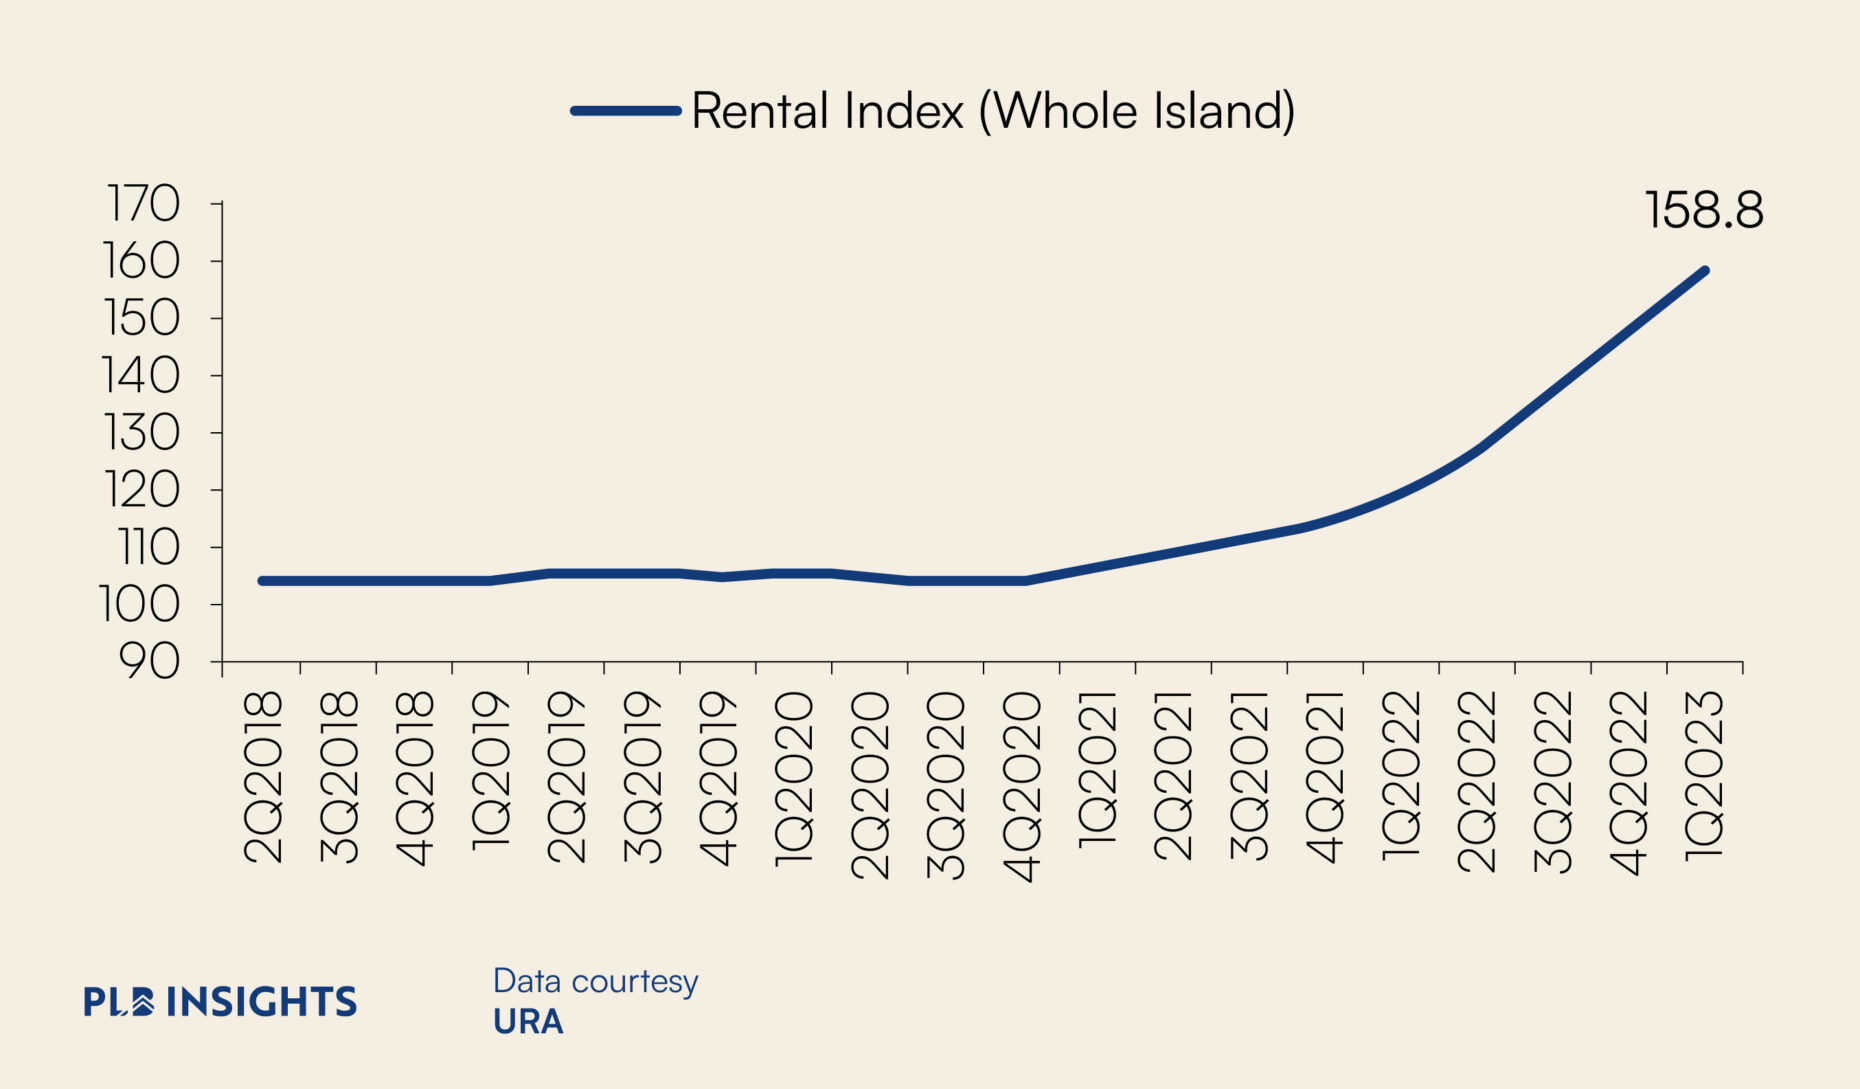
The Urban Redevelopment Authority (URA) has released its latest rental index for the first quarter of 2023, showing a rise of 7.2% from the previous quarter. This marks a continued upward trend in Singapore’s rental market, which has seen steady growth in recent years.
The URA rental index is a key indicator of rental prices in Singapore and is based on data from private residential properties. This latest increase suggests that rental prices in Singapore are still on the rise, and many are wondering if they are finally nearing their peak.
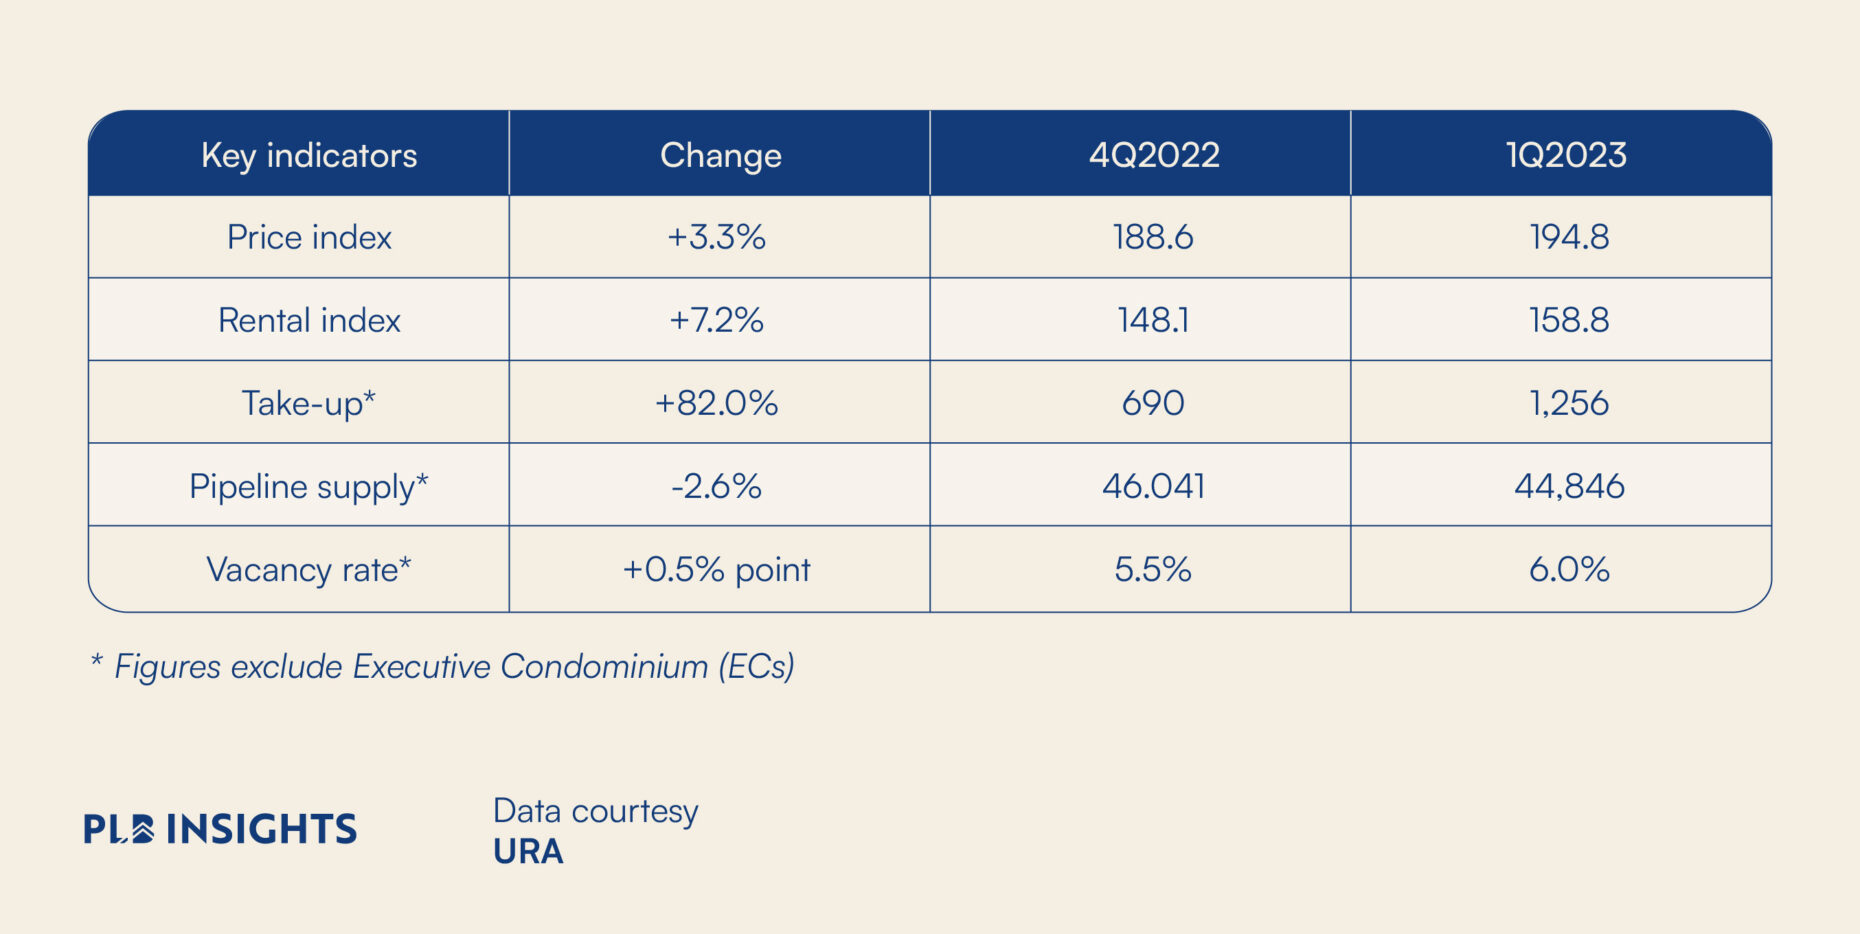
The URA rental index has been steadily increasing over the past few years, with a 2.2% increase in 2021Q1 and a 4.2% increase in 2022Q1. The latest 7.2% increase in Q1 2023 suggests that the trend is continuing, albeit at a much faster pace.
Despite the continued acceleration in rental prices, some analysts believe that Singapore’s rental market may be nearing its peak. The government has implemented various cooling measures in recent years to curb rising housing prices, and there are signs that these measures may be starting to take effect with gradually declining rental transaction volume. However, there might still be deeper fundamentals that continue to sustain high rental prices.
Differences in Rental Performance across Regions & Segments
The Urban Redevelopment Authority (URA) rental index for the first quarter of 2023 shows that rentals for private residential properties in Singapore have increased by 7.2%. This is a significant increase, but the pace of the increase is slightly slower than the previous quarter’s 7.4% increase. The URA rental index is a reliable indicator of the current state of the rental market in Singapore, providing valuable insights into rental trends and the direction in which the market is heading.
The rental market for non-landed properties in Singapore has moderated, with an increase of 6.2% in the first quarter of 2023. This is a small drop from the previous quarter’s 7.5% increase. Landed properties, on the other hand, have seen a significant increase in rental prices, rising by 14.5% in the first quarter of 2023, compared to the 6.3% increase in the previous quarter.
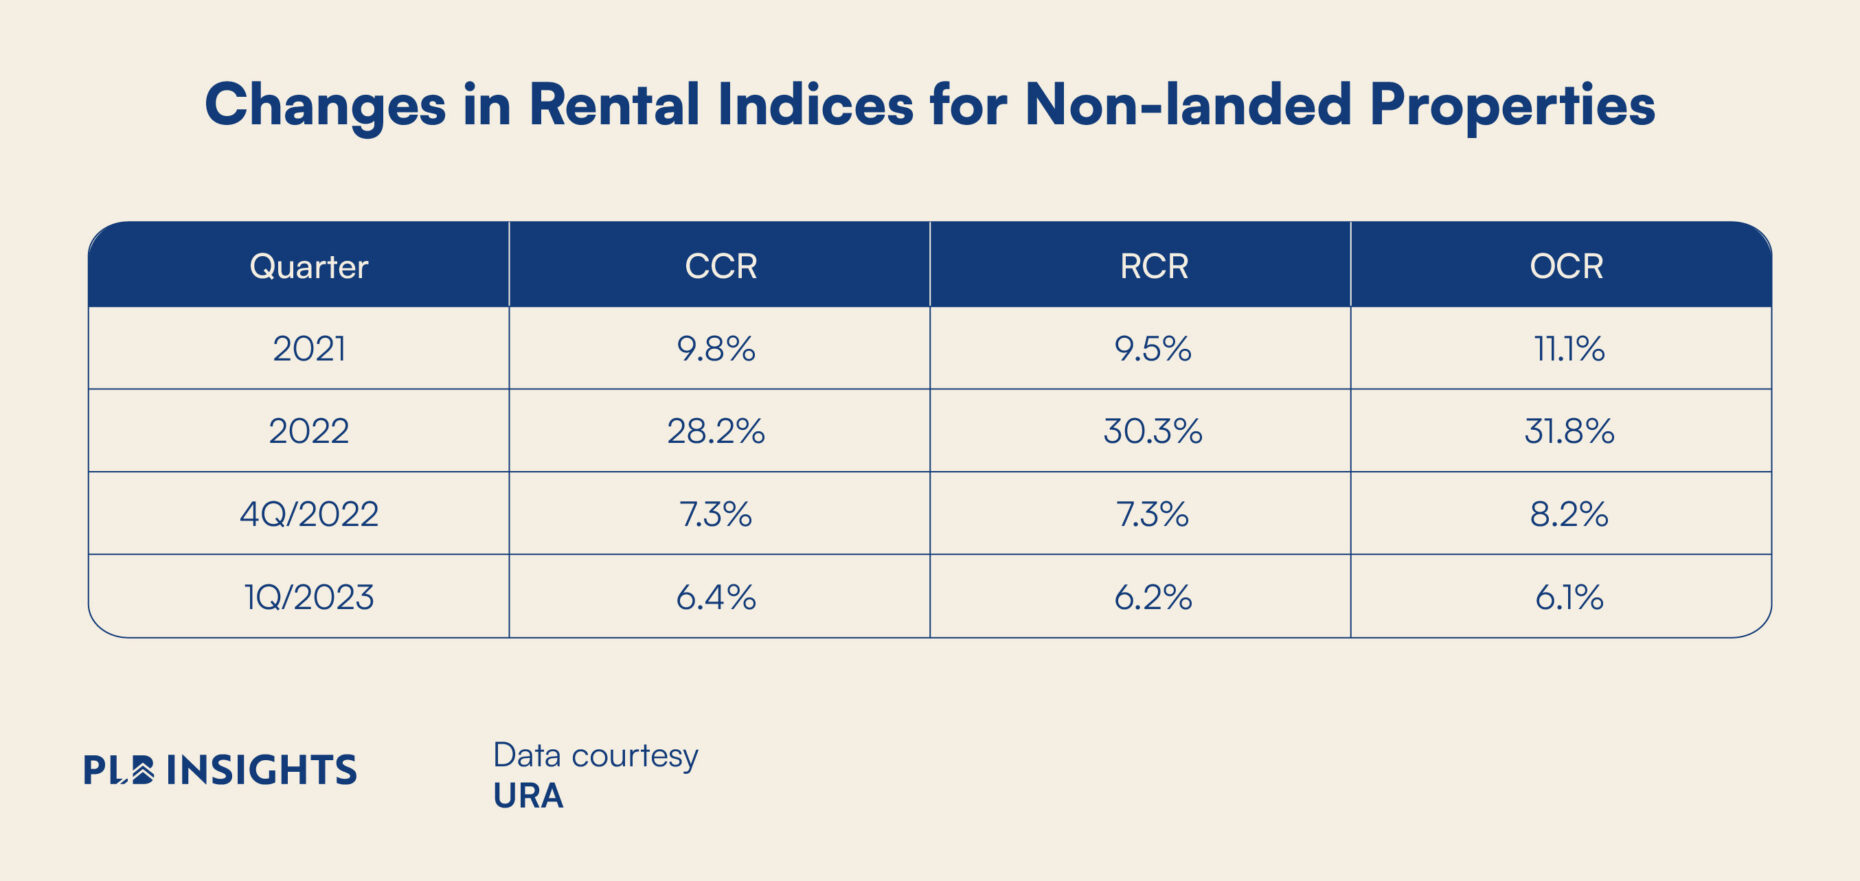
Breaking down the URA rental index by region shows that the Core Central Region (CCR) saw a rental increase of 6.4% in the first quarter of 2023, compared to the 7.3% increase in the previous quarter. Similarly, the Rest of Central Region (RCR) saw an increase of 6.2%, compared to the 7.3% increase in the previous quarter. The Outside Central Region (OCR) saw an increase of 6.1% in the first quarter of 2023, a decrease from the previous quarter’s 8.2% increase.
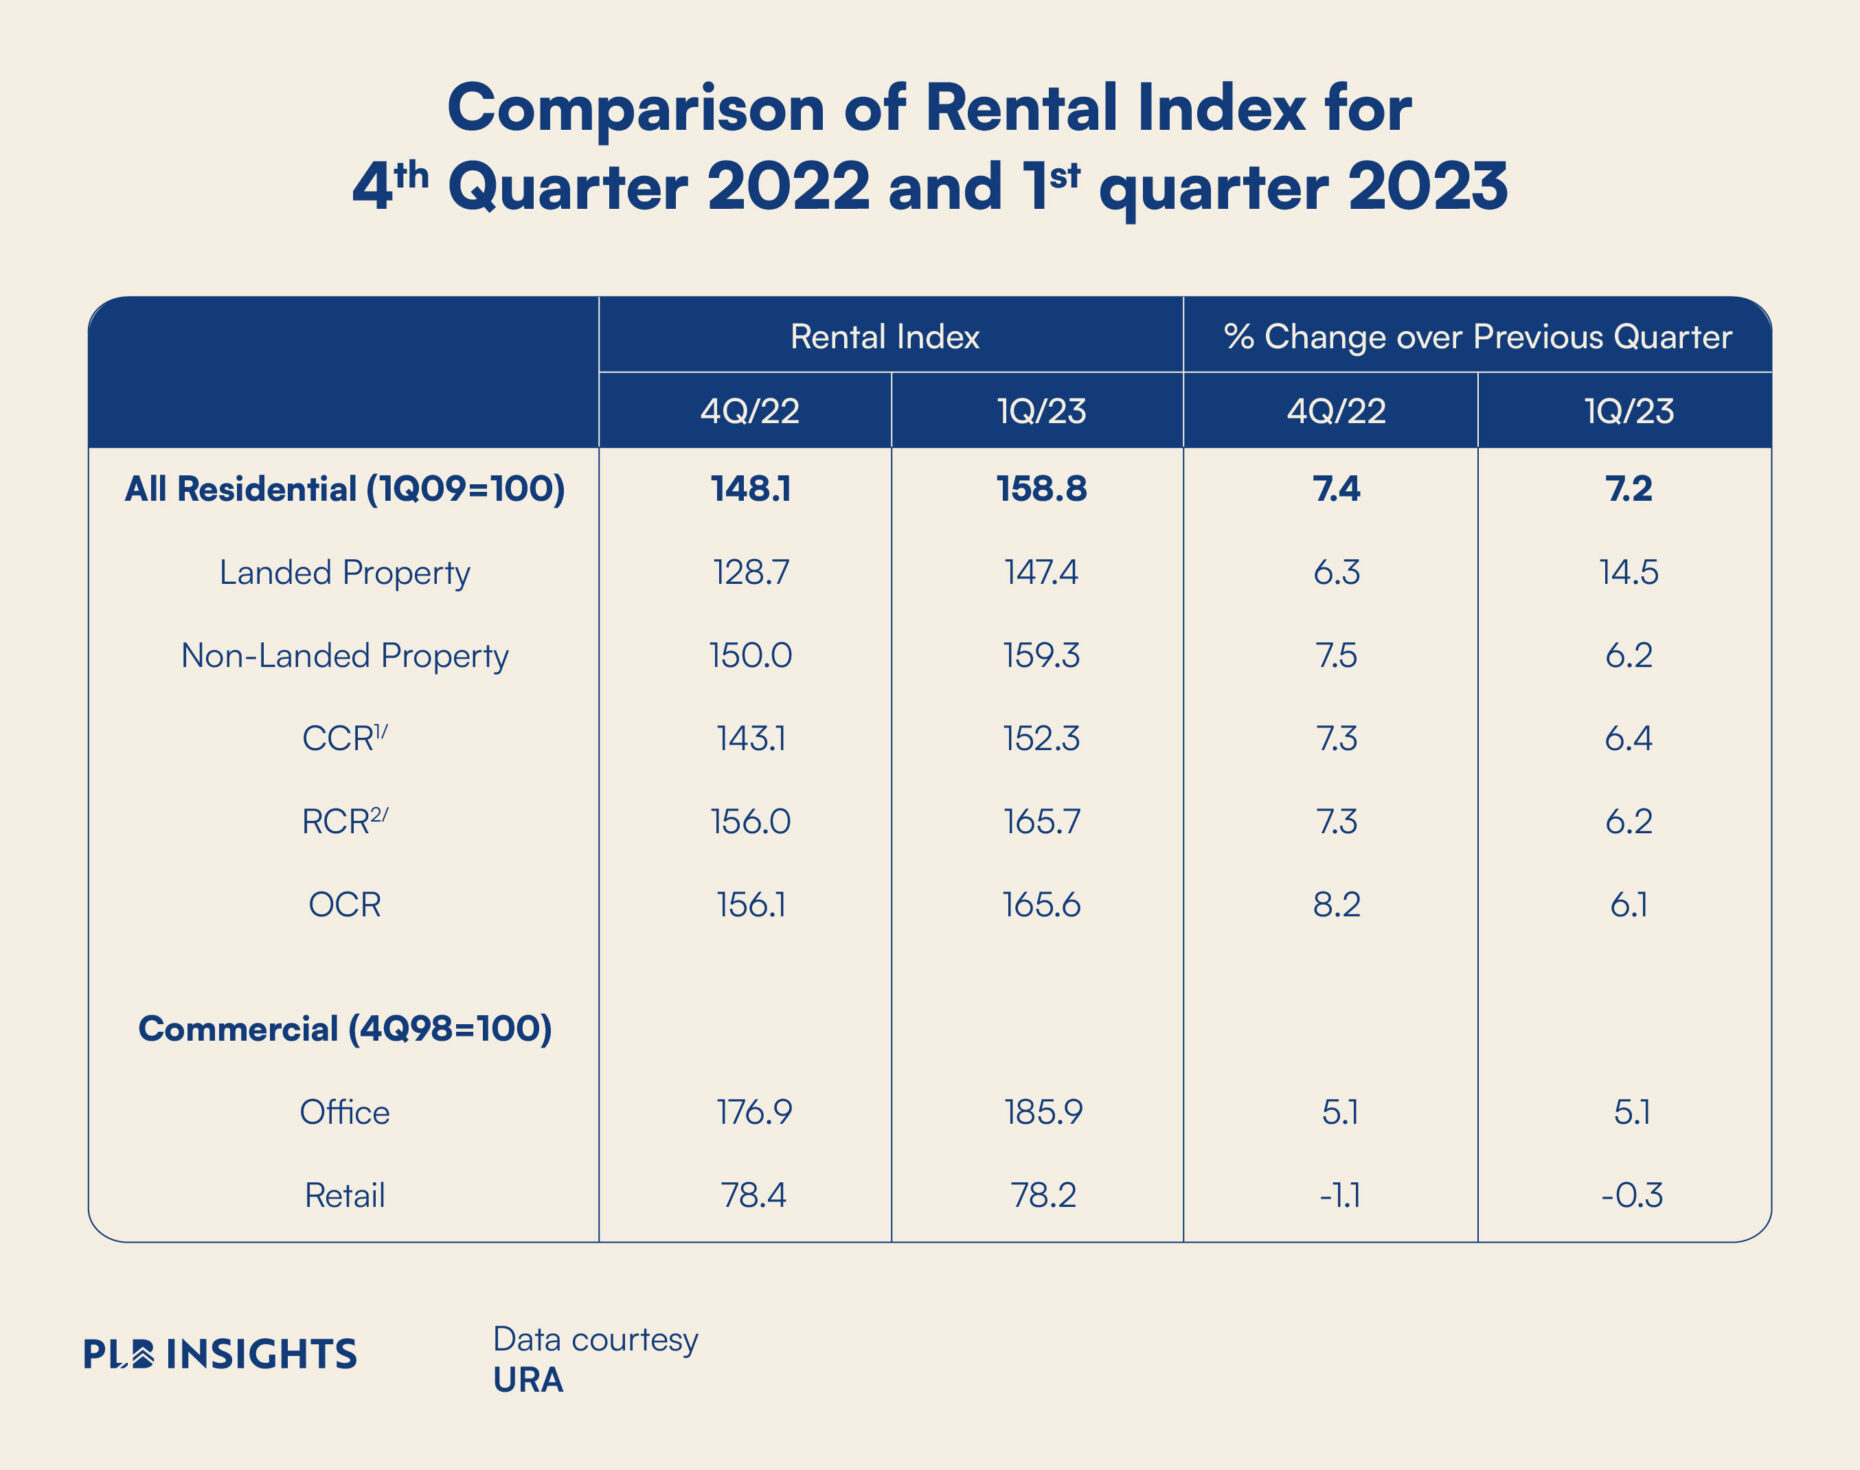
Do note that these numbers indicate that rental prices are generally rising at a slower pace across regions. However, rental prices are now rising at a faster pace in the Landed segment than the Non-Landed segment. Overall, prices are rising at a slightly slower pace, but are still at a very high level.
The increase in rental prices for landed properties is a significant trend that deserves attention. With the prices of non-landed properties having risen to higher levels, some renters may see more value in paying a small differential to get a larger rental like a landed property. This could indicate a stronger demand for landed properties, which often offer more space and privacy. The increase in rental prices for non-landed properties, while slower than the previous quarter, still represents a considerable increase in rental prices for this property type.
In order to have a clearer picture of the demand and supply situation, we need to take a look at the changes in transaction volume as well. While prices have been increasing, we observe declining volume accompanying this upward trend, indicating that the quantity demanded for rentals at higher prices are dropping.
Changes in Rental Transaction Volume Trends across Segments
When examining the volume trends, we will first discuss the Non-Landed segment (excluding ECs) followed by the Landed segment. We separate out these segments to find out how the rate of increase for prices corresponds to the changes and rate of decrease for volume. This might give us clues as to whether the trend might be near the peak or perhaps not at all.
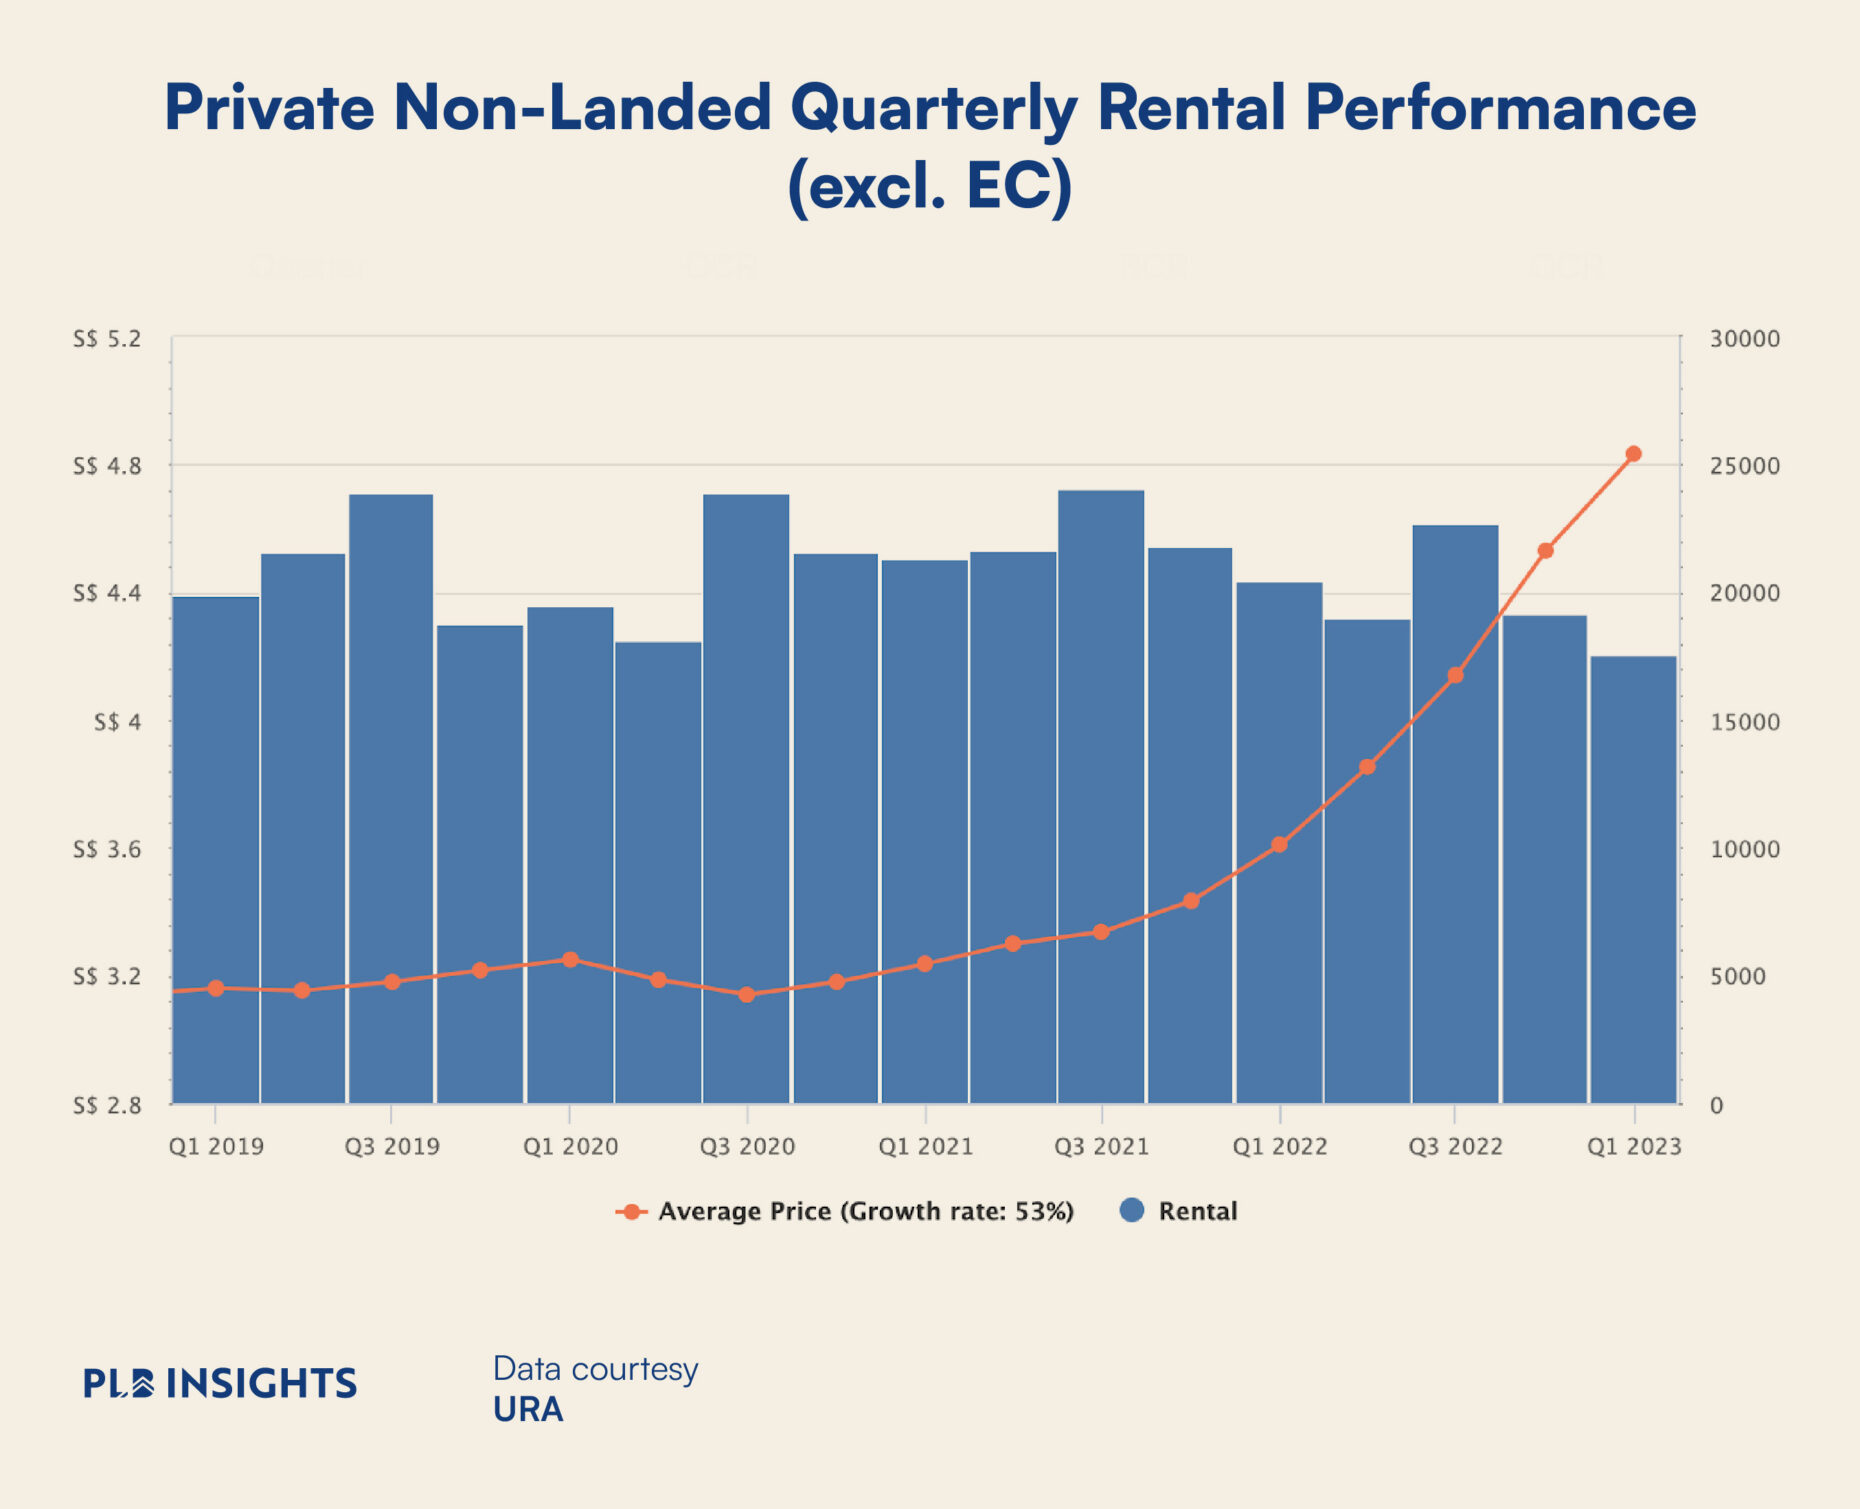
The Non-Landed segment had a decline of 16% in transaction volume from 2022Q3 to 2022Q4. Subsequently, there was a decline of 9% in transaction volume from 2022Q4 to 2023Q1. The rate of decrease for rental transactions volume has slowed. But the decline of rental transaction volume has a higher magnitude than the rise in prices, suggesting that demand for rentals is falling.
However, it is important to note that the rental data exhibits mild seasonality. Quarter 3 of every year seems to experience a spike in rental transaction volume. This might have to do with when tenants and landlords renew their leases in the market. The caveat here is that the recent decline in transaction volume occurs in 2022Q4 and 2023Q1. As a result, we cannot tell for sure if the declining demand is mostly a result of contract renewals peaking in Q3 or a result of high rental prices.
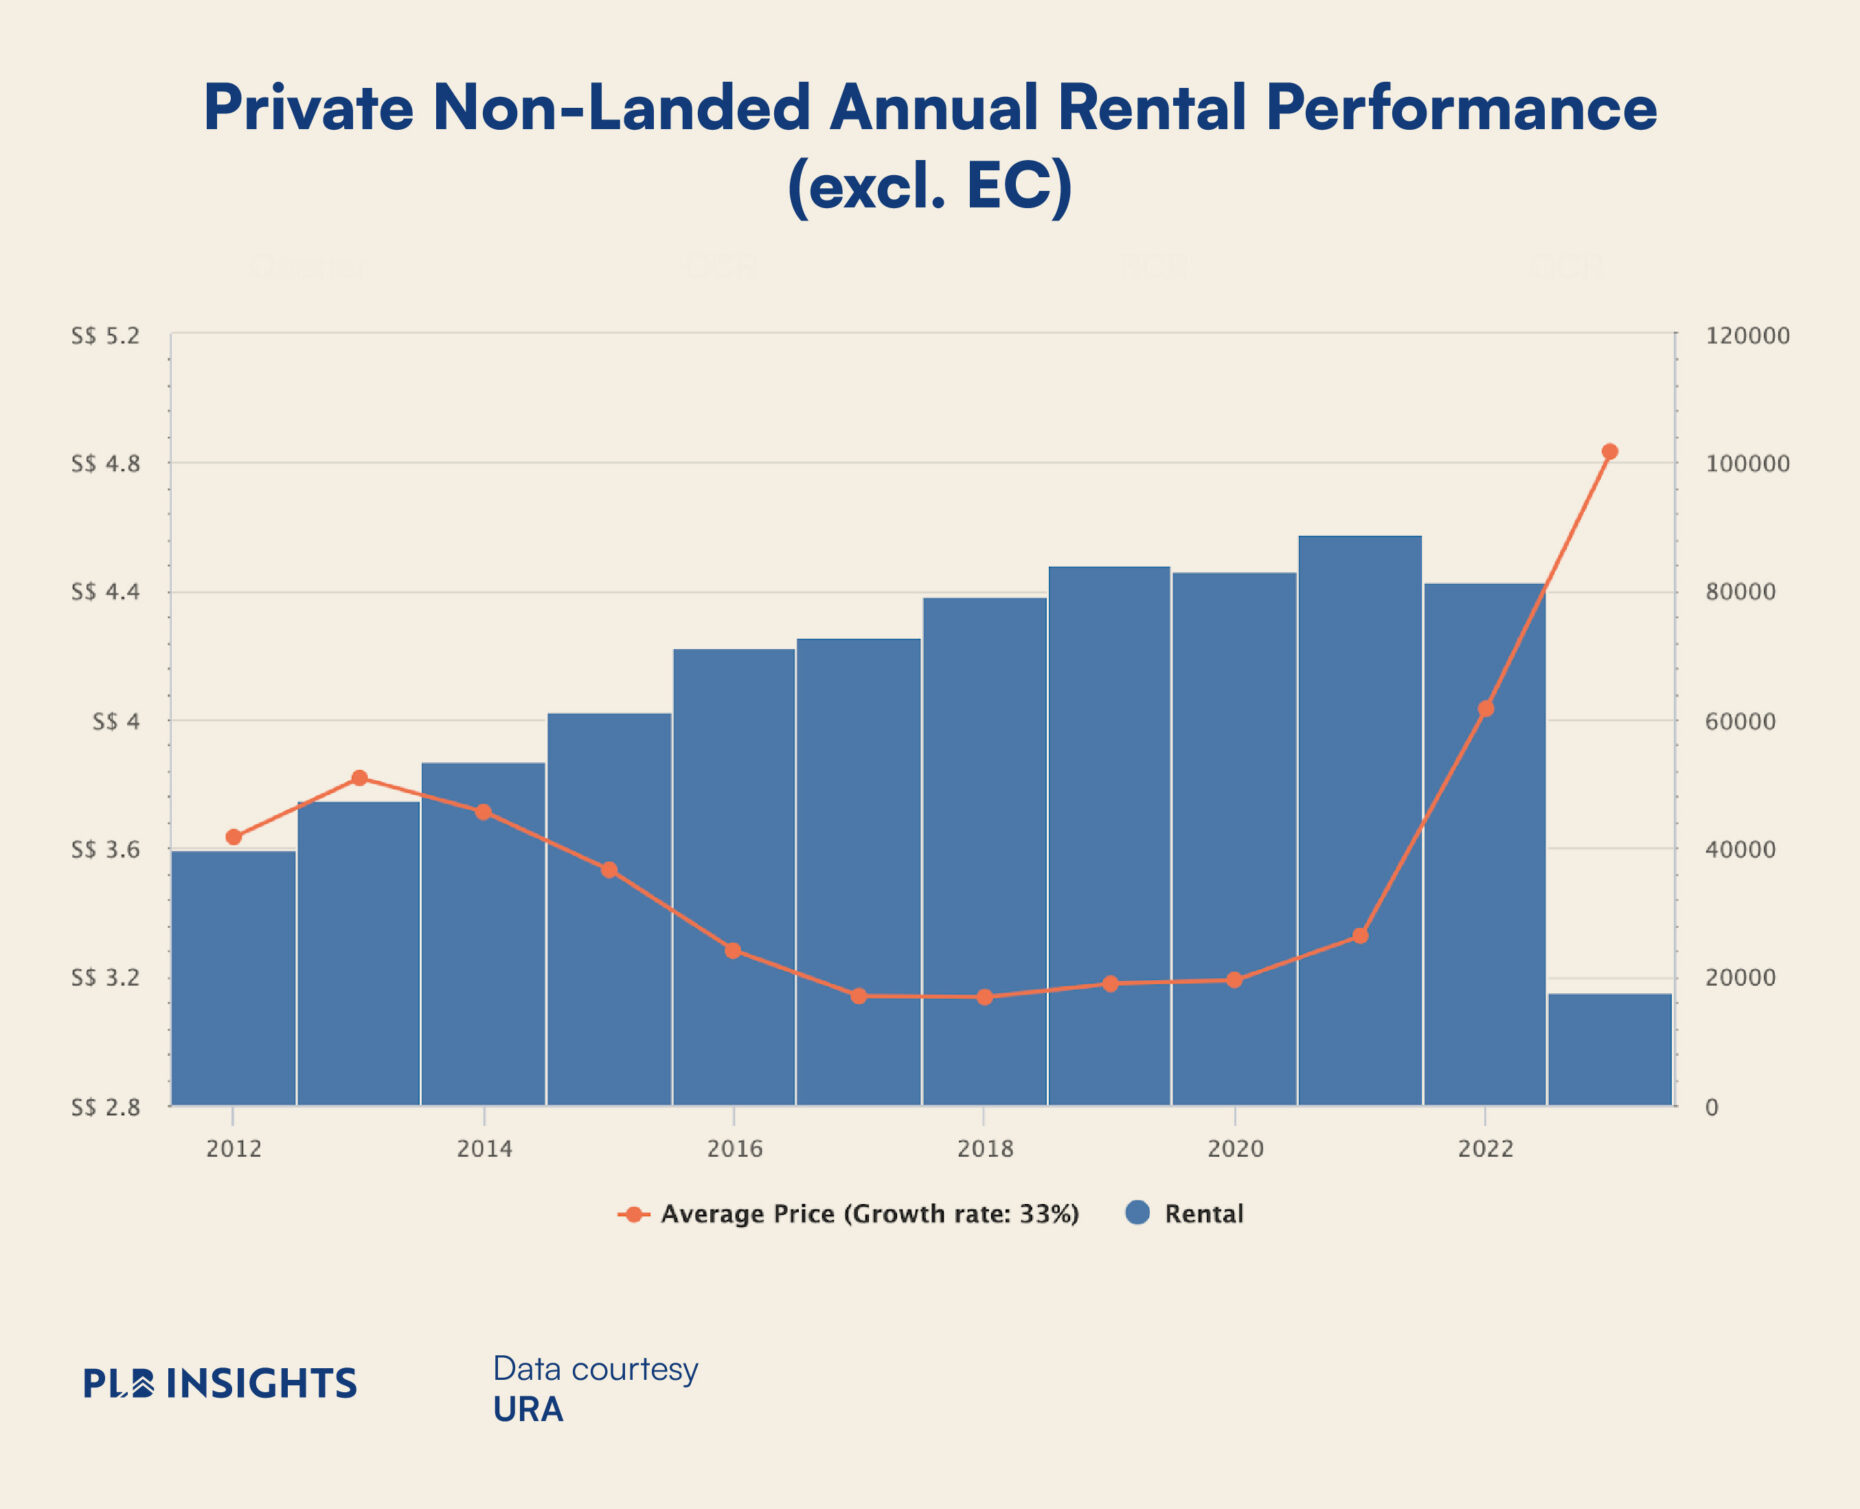
In reality, it is likely the combination of both the lease renewal cycle and the higher rental prices. In the much larger trend over the course of the past decade, the volume of rental transactions have generally increased and exhibit a strong positive trend. Price on the other hand, has fluctuated substantially with less-than-proportional decline in volume. From 2021 to 2022, there was only a decline of 9% in transaction volume for the Non-Landed Segment (excl. EC) while rental prices grew by 21%. On the larger scale, it is plausible that rental prices continue to rise further due to price inelastic demand when the seasonality aspect is assumed to be averaged out across years.
The Landed Rental segment has some similar patterns but has nuanced differences from the Non-Landed segment. As noted earlier, the Landed Rental segment rose 14.5% in 2023Q1, this is significantly higher than the 6.3% rise in 2022Q4. As we can see in the chart below, the steep acceleration in rental prices was accompanied by a lower transaction volume.
Similar to the Non-Landed Rental segment, the Landed Rentals in Singapore exhibit seasonality in the transaction volume of rental contracts. Again, the lease renewal pattern seems to peak in Q3 of every year. As a result, we are unable to tell how much of the recent decline in rental transaction volume should be attributed to the higher prices on the market. Importantly, 2022Q4 seemed to have a much higher transaction volume compared to the same period in previous years.
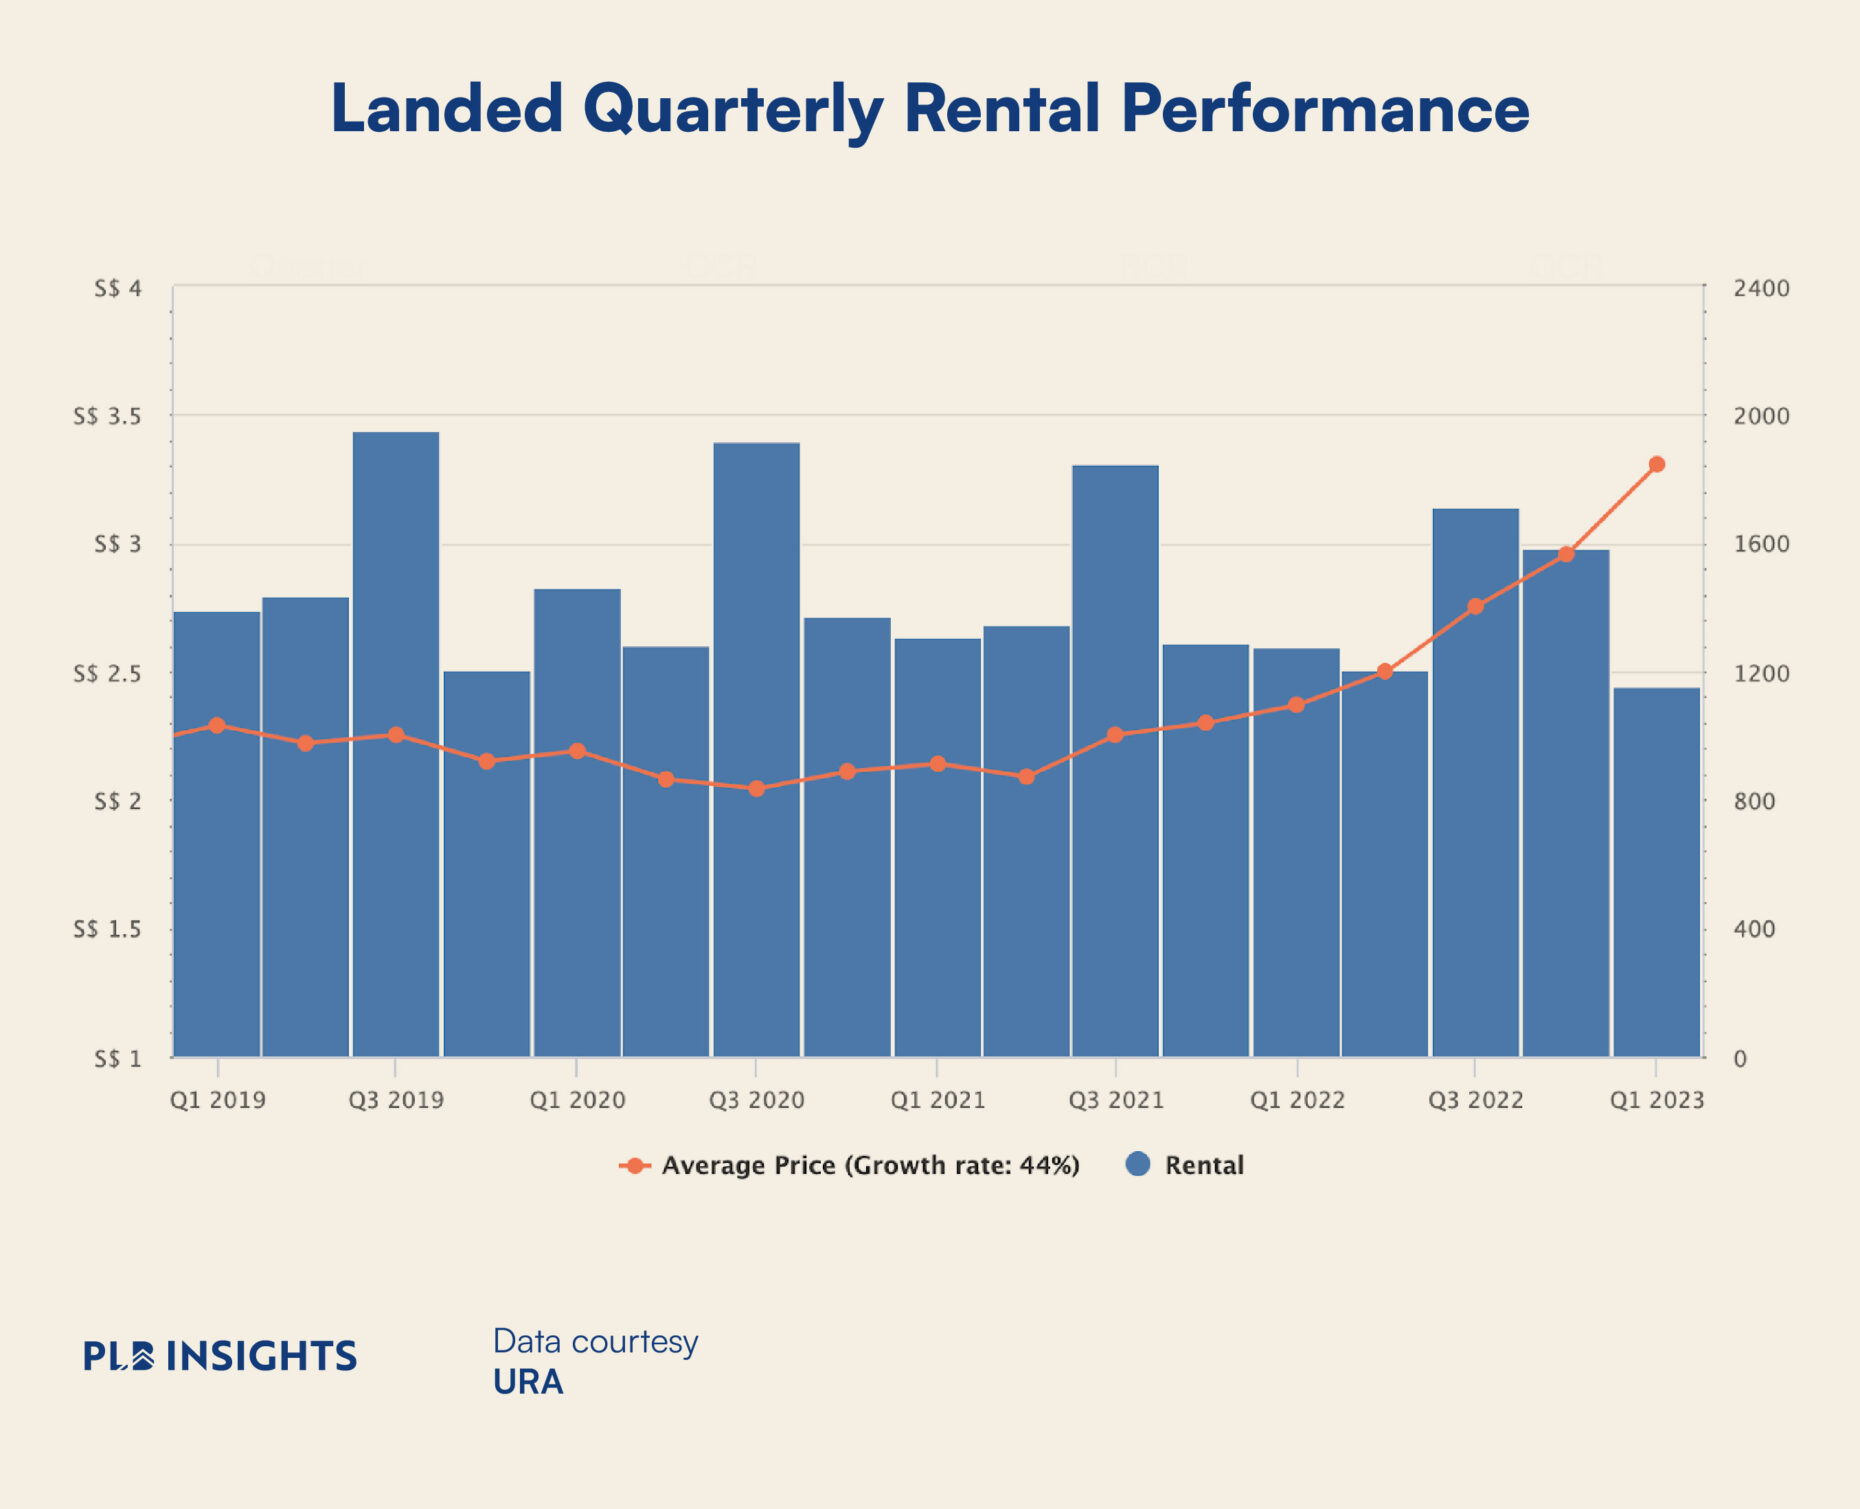
From 2022Q3 to 2022Q4 there is a decline in volume by 8% in the Landed Rental segment, while rental prices rose by 6.3%. Subsequently, from 2022Q4 to 2023Q1 the decline in volume accelerated to 27% with a 14.5% increase in price. We now look at how the larger trend appears and contrast it to the Non-Landed rental segment.
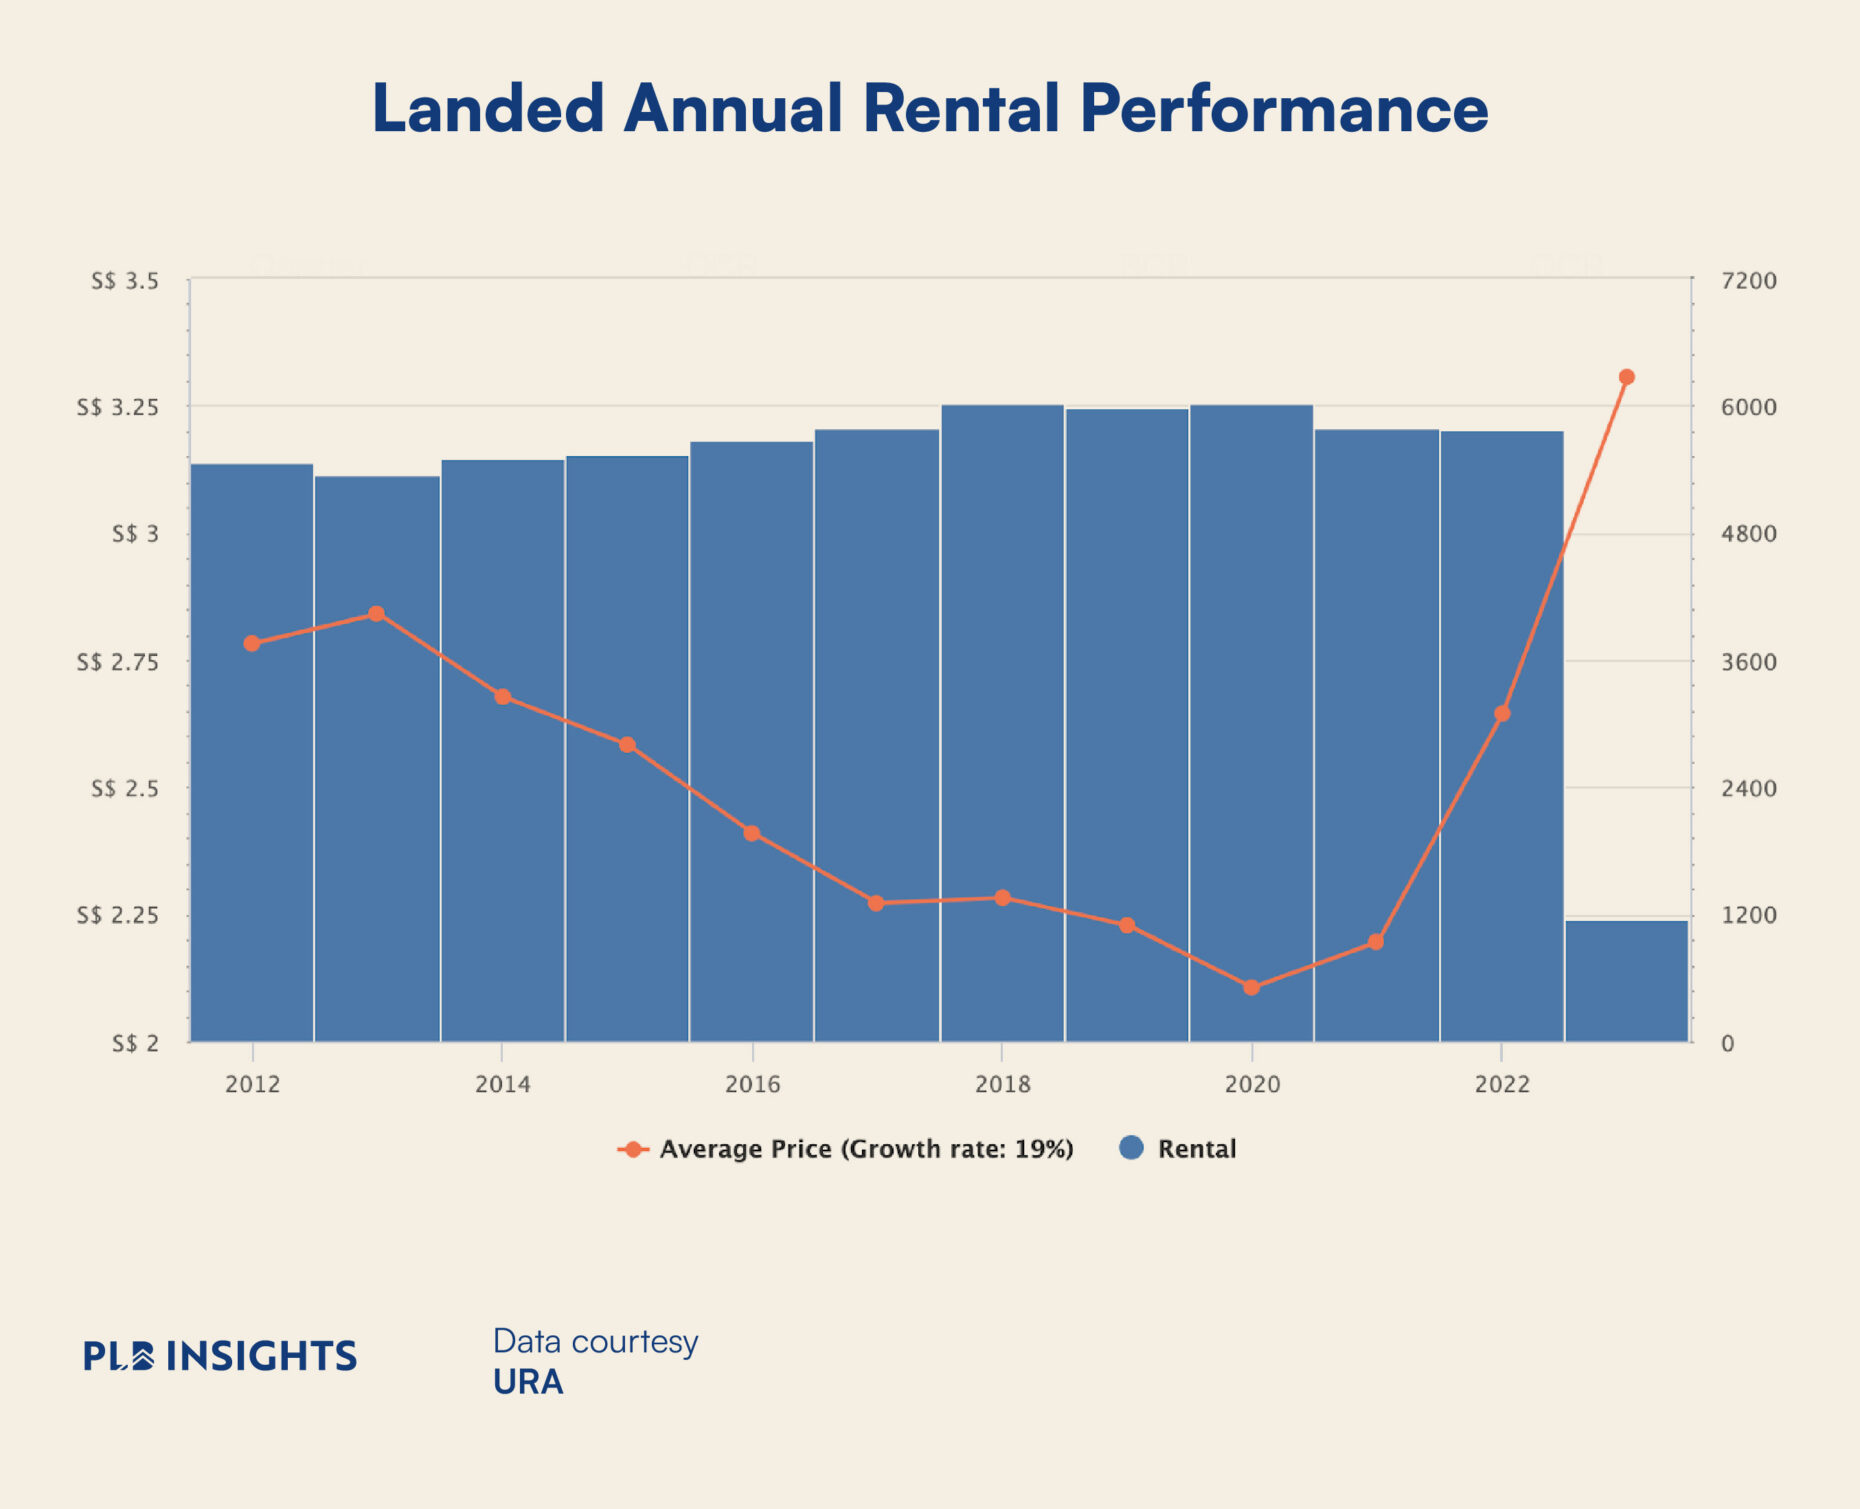
On an annual basis, we see that the seasonality is averaged out, and there are no strong volume differences in general. From 2020 to 2021 decline in volume of 4%, while the period from 2021 to 2022 has declined by 1%. This again shows the insensitivity of the volume of transactions to the rental prices across a much larger time frame.
Changing Fundamentals in Singapore’s Rental Market?
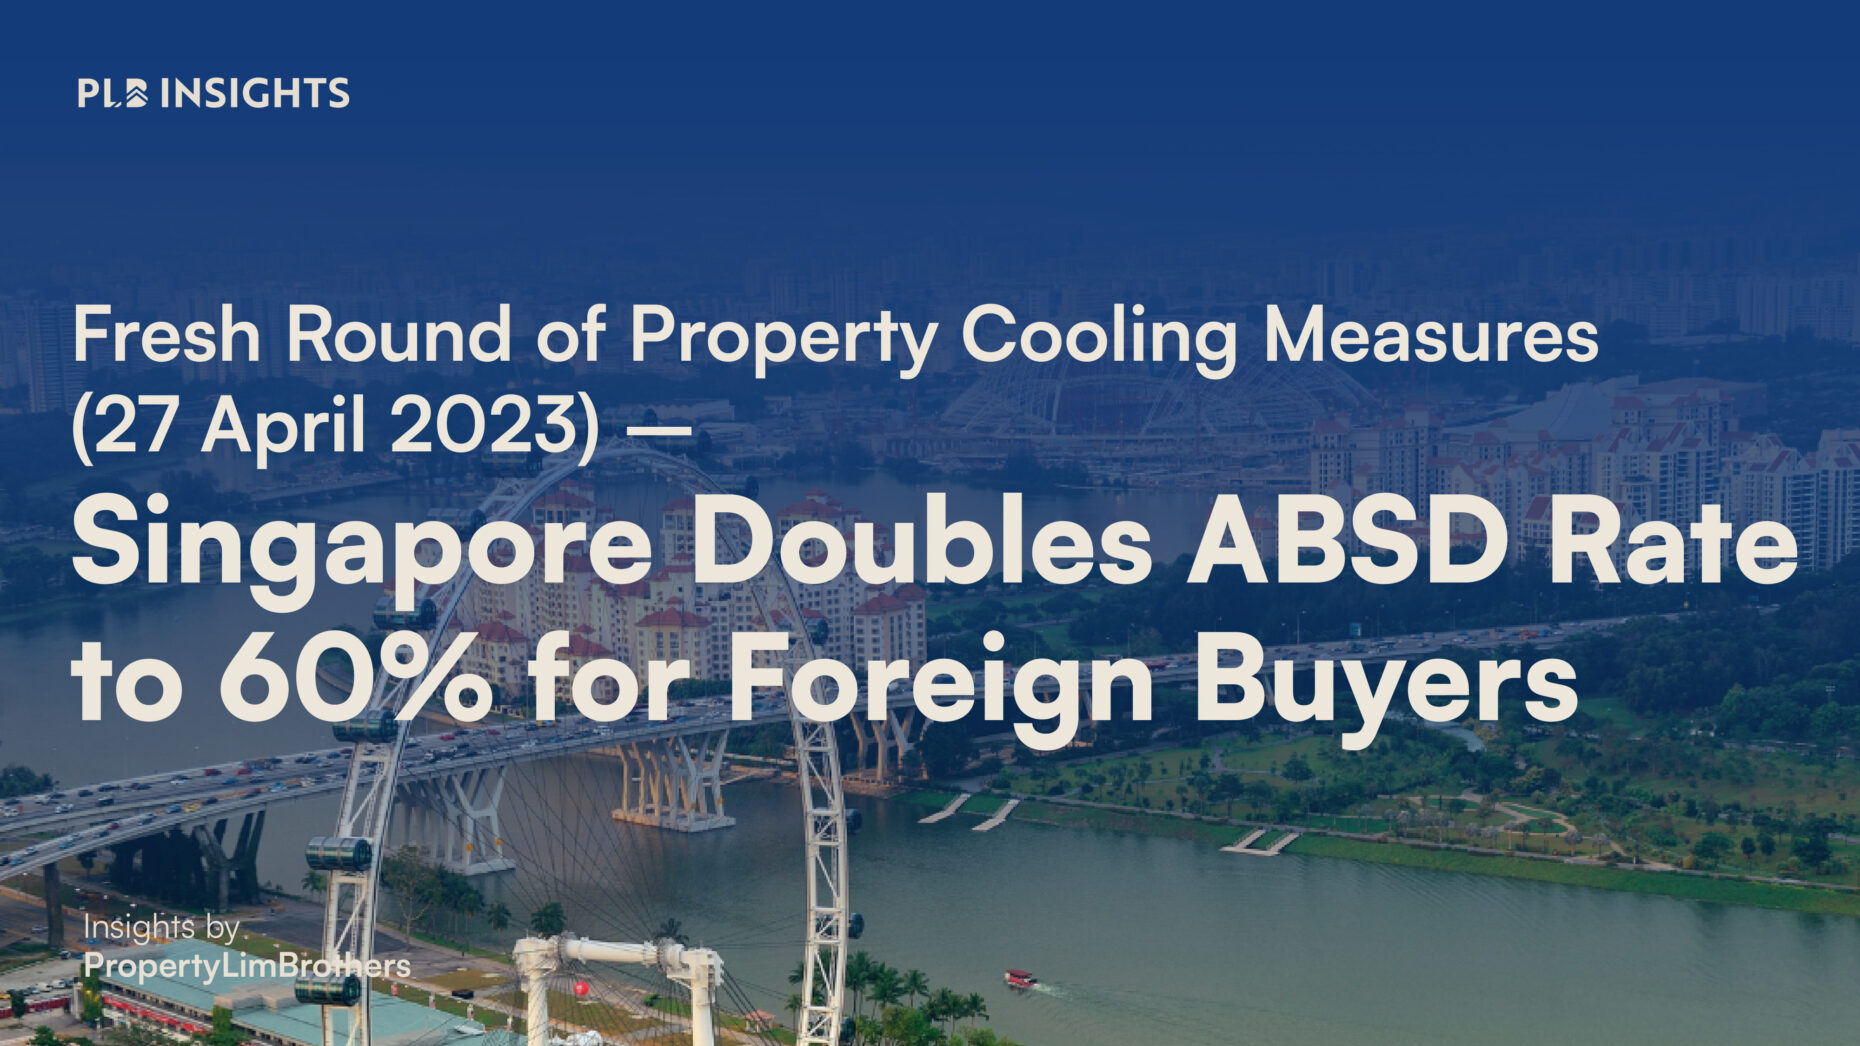
The recent increase in Additional Buyer’s Stamp Duty (ABSD) might price out many foreign buyers who are residing or are planning to move to Singapore. The hefty increase from 30% to 60% for foreign buyers might push this audience to rent in Singapore rather than purchase a property. As a result, we may see an increase in rental interest in the coming months that will help prop up the rental market even further.
Some proponents of the rental market reaching the peak commonly mention the added supply of private residential units from TOP projects to the market. While this is a substantial increase in residential units made ready for living, there will be a significant amount of homeowners intending to use the property for their own stay. Another group would likely want to capitalise on the gains made in the recent 4 years of the property boom. And the remaining might look to rent out their property for rental income. Between the 3 groups, the later 2 take up a minority of the units in circulation.
While the above mentioned reasons counteract to create a consolidation period for rental prices, there are some other changing fundamentals that we need to consider in order to have a clearer picture of where the rental market might be headed at large. Most importantly, we look at the Permanent Resident, Expatriate, and Foreign Labour market situation in Singapore. Despite a recent downgrade in Singapore’s growth forecasts, Singapore’s labour market remains resilient and companies here are still looking to expand. This might paint a mixed picture for the rental market in the short run but fundamentals are generally positive moving past the recessionary concerns.
Closing Thoughts
Across the analysis, we have noticed how changes in volume might not really be a strong sign of slower price hikes. The demand for rentals in the Singapore market seem to be inelastic to some degree when we look at the segments in totality. It might be important to pay more attention to potential shifts in the fundamentals of the rental market rather than technical price changes when we are looking at the short to medium term changes.
The prices in the rental market are looking to remain relatively hot at present. We will need to see how the market reacts to the introduction of condominium and apartment projects that will TOP this year to have more insight on where rental prices might be going in the near future.
If you are keen to learn more about how the shifts in the market will affect your rental properties, or how you can effectively navigate the rental market in Singapore, contact us here!