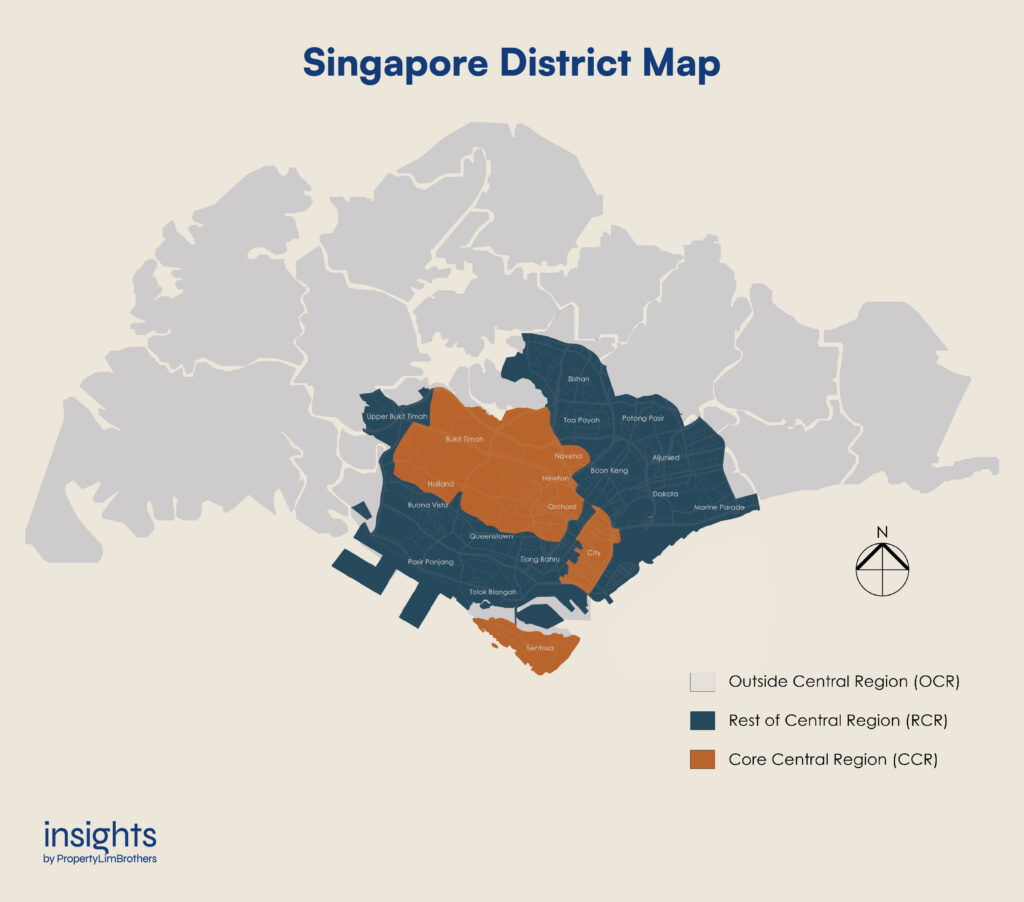
Have you ever come across locations of properties being referred to as part of the CCR, RCR, or OCR and wondered what they are referring to? These acronyms are used by the Urban Redevelopment Authority (URA) as “market segments” to divide the 28 districts in Singapore into three regions.
They stand for: Core Central Region (CCR), Rest of Central Region (RCR), and Outside Central Region (OCR).
In this article, we take a look at Singapore’s District Map and the general property trends in relation to the different regions.
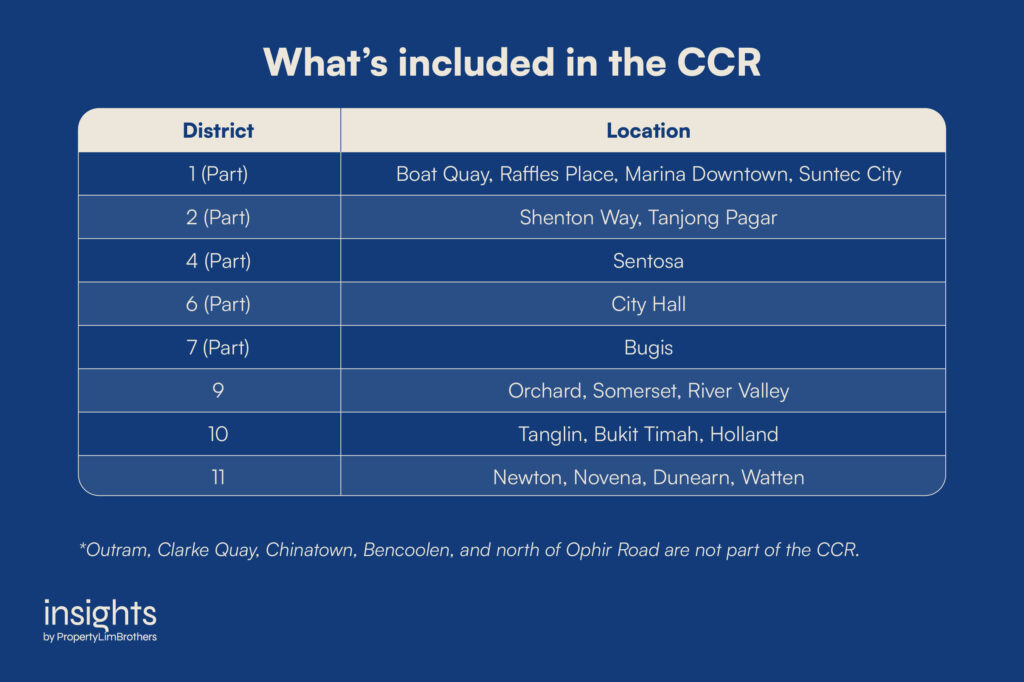
Core Central Region (CCR): City, Downtown Core, Sentosa
The Core Central Region, or CCR, comprises Sentosa plus Singapore’s traditional core locations, such as postal districts 9, 10, and 11, the Downtown Core, and parts of Bugis plus the south of Ophir Road.
The CCR is known for its premium luxury properties, with many private residential properties being freehold in nature. A large percentage of Good Class Bungalows (GCBs) can also be found here, mainly in Districts 10 and 11. In the last five years, GCBs in the CCR remain a hot favourite, providing their owners with higher returns than other regions in terms of average PSF and absolute quantum (+12.9% and S$8.3M).
In the past, wealthy foreigners were the primary audience for non-landed properties in the CCR because of the many benefits of living in a central location – prestigious schools, good F&B options, and a wealthy neighbourhood. However, with the Additional Buyer’s Stamp Duty (ABSD) introduction in 2012 to cool the rapidly increasing property prices, overall demand for foreign purchases was dampened. CCR properties, being the most popular amongst foreign buyers, were hit the hardest. The high duties, on top of the already expensive properties, slowed down the appreciation of prices in the CCR.
The trend has shifted towards locals buying most CCR properties, creating a self-supporting market. Taking Irwell Hill Residences as an example, over 50% of its units were sold on launch weekend, with Singaporeans accounting for 80% of the purchases. This signals that the CCR market will soon catch up to the price appreciation that other market segments have experienced.
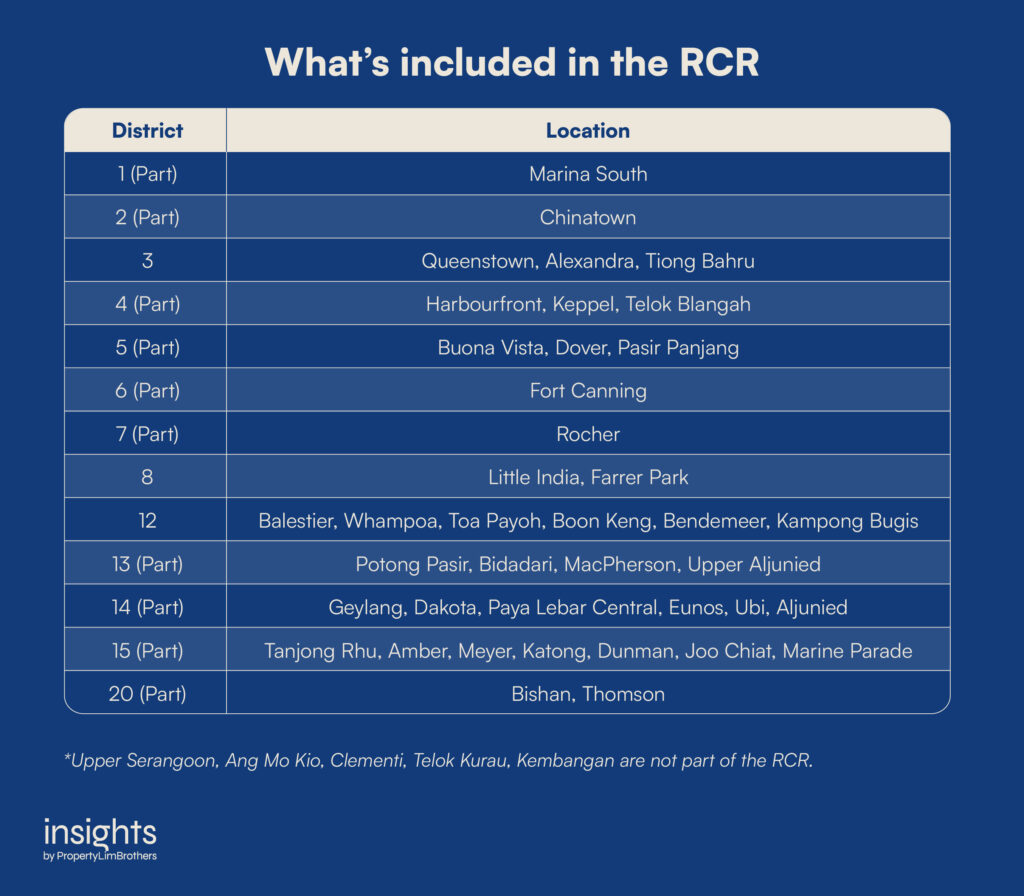
Rest of Central Region (RCR): Central Areas excluded from CCR
The Rest of the Central Region, or RCR, comprises central areas not part of the CCR. The region between Bencoolen and Rochor, tucked between the Downtown Core and District 9, is also considered RCR. Other areas with a central location, such as Chinatown, Outram, Little India, and Tiong Bahru, also fall under the RCR.
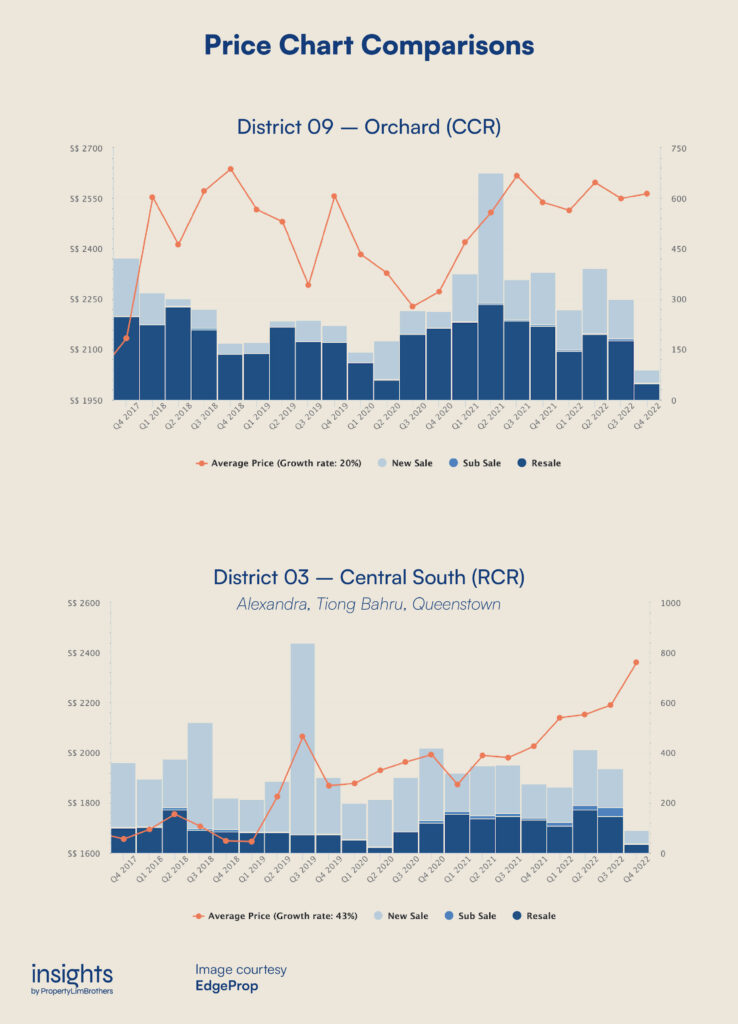
Price Chart Comparisons
The RCR used to serve as a middle ground between high-value properties in the CCR and mass market properties within the OCR, offering mid-tier or intermediate properties such as last year’s Midtown Modern. However, the gap between CCR and RCR properties has been closing in recent years amid solid growth in the RCR.
A big reason why this is happening is the decentralisation of the Central Business District (CBD). It is part of the government’s key strategies for future urban planning – creating more office spaces in the RCR (and beyond) to reduce the influx of workers to CBD during peak hours, putting tremendous pressure on infrastructure. Since more office spaces are shifting out of the CBD, RCR properties have easy access to the city centre and office spaces within their immediate vicinity. This would boost rental demand in the RCR and give investors a wider tenant pool.
Outside Central Region (OCR): The rest of Singapore
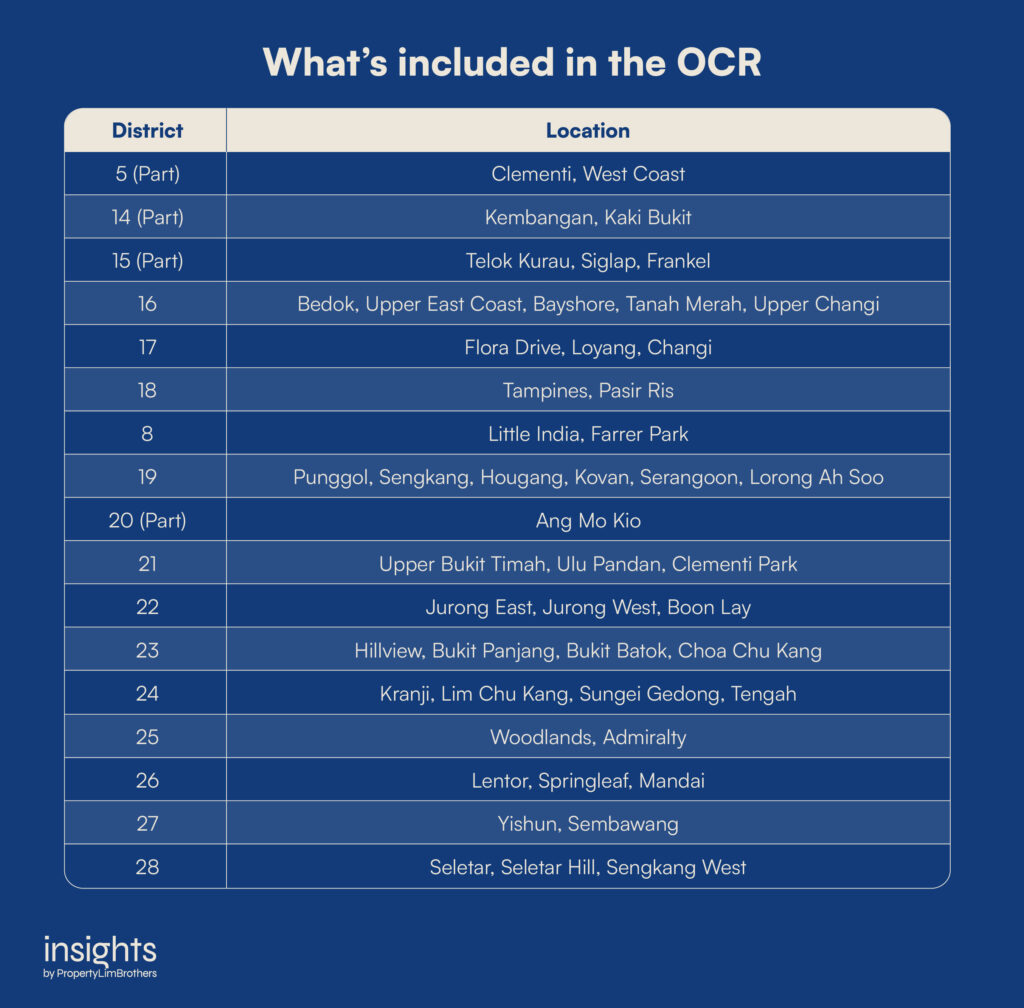
The Outside Central Region, or OCR, comprises areas outside the CCR and RCR, essentially the rest of Singapore. Spanning around three-quarters of Singapore, the OCR is the largest market segment.
Traditionally, the OCR comprises areas where you can find mass-market properties at lower quantum prices. However, prices in the OCR have been trending up since the pandemic. In 2022, HDB resale flats in several OCR towns like Woodlands and Pasir Ris have recorded million-dollar transactions despite inflation and interest rates hitting all-time highs. Integrated developments in the OCR have also been fetching a higher premium. One of this year’s hottest new launches, Lentor Modern, fetched a PSF benchmark of S$2,150 as the first integrated development in the Lentor area. Other mixed-use developments would likely follow suit, with developers setting a 20-25% premium over other private condos in the same area.
A big reason for the price movement in the OCR lies in the development plans that URA has laid out for several districts in this region. In Woodlands, the Woodlands Regional Centre will become the largest economic hub in the North of Singapore. In Paya Lebar, the Paya Lebar Airbase will be relocating to make way for 150,000 new homes; the building height restrictions in the area will also be lifted, allowing the redevelopment of towns such as Hougang, Punggol, and Marine Parade. Speaking of Punggol, Punggol North is also set to be developed into Punggol Digital District, bringing together the Singapore Institute of Technology (SIT) ‘s campus and JTC’s Business Park spaces.
The development of new commercial and residential spaces, the rejuvenation of existing developments, and upcoming MRT networks will serve to decentralise the CBD and make the properties in OCR as attractive as those from CCR and RCR.
Closing Comments
We hope this article has helped you understand how the different districts in Singapore are being divided. Whether you are buying or selling, remember that trends arising from this segmentation of districts could be due to psychological or societal pressures. The difference in regions may affect property prices even though they are geographically located in the same area.
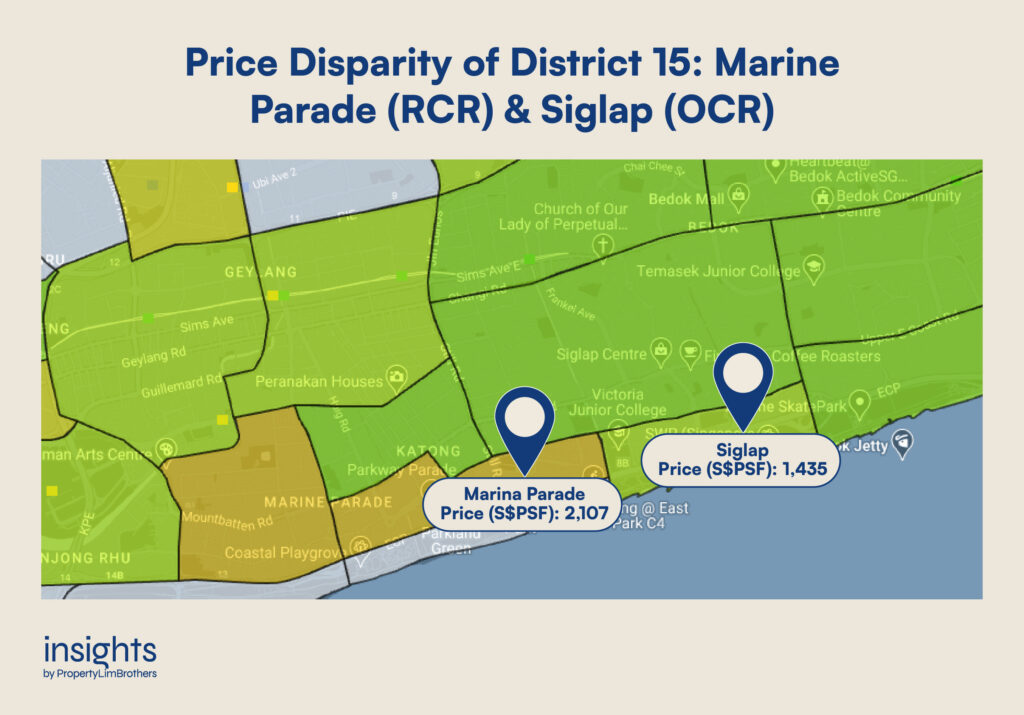
For example, properties in Marine Parade have an average PSF of S$2,107, while properties in Siglap have an average PSF of S$1,435. Although they are both located in District 15 (in fact, they are right beside each other on the map), Marine Parade falls under the RCR, while Siglap falls under the OCR. That is a significant disparity in prices!
When it comes to location, it is ultimately up to each individual’s preference. However, you need to be very aware of such disparities in market segmentation when making your property decisions. If you have any questions or need a second opinion, feel free to contact us or reach out to our Inside Sales Team members via their socials. See you in the next one.
